Disclaimer
This analysis is for informational purposes only and does not constitute financial advice. All investment decisions involve significant risk, and this analysis represents solely the opinion of AI-generated research. Readers are strongly advised to conduct their own research and consult with a qualified financial advisor before making any investment decisions. Past performance does not guarantee future results.
1. Technical Analysis Interpretation
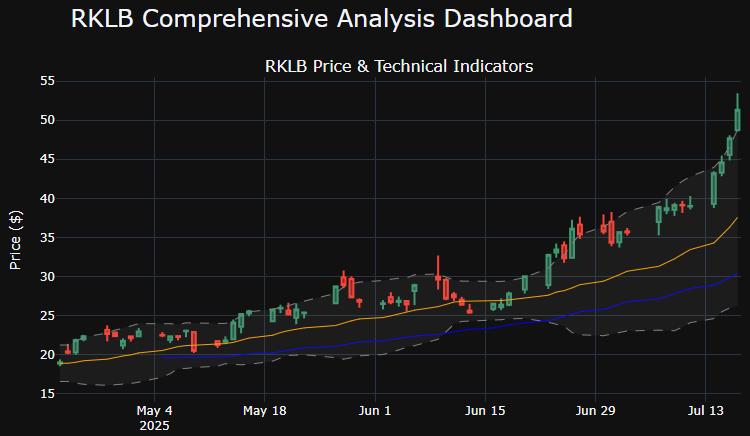
Rocket Lab (RKLB) currently trades at $51.33, sitting precisely at its 52-week high and displaying concerning overbought conditions across multiple technical indicators. The stock’s recent 10-day surge has generated significant momentum, with the close-open ratio of 0.098 indicating strong intraday buying pressure.
Key technical drivers reveal a mixed but predominantly cautionary picture. The On-Balance Volume (OBV) indicator at 0.064 suggests moderate accumulation, while the high-low ratio of 0.066 indicates healthy trading ranges despite the elevated price levels. However, the stochastic indicators (K: 0.074, D: 0.079) signal the stock remains in overbought territory, though not at extreme levels.
The RSI reading of 86.9 presents the most concerning technical signal, indicating severe overbought conditions that historically precede pullbacks or consolidation periods. The Bollinger Band position of 1.11 further confirms the stock is trading significantly above its upper band, reinforcing the overbought thesis.
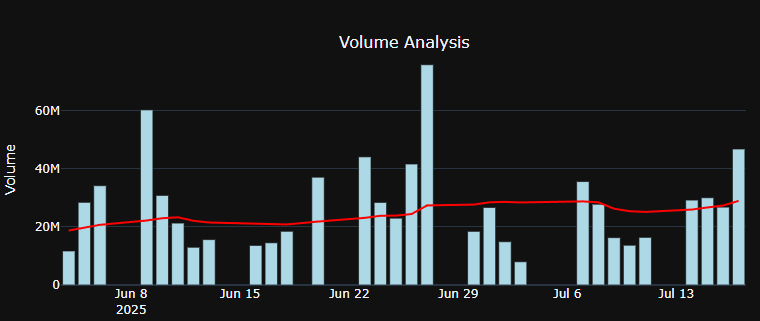
Volume analysis shows exceptional activity with a 2.31x ratio above average, supporting the recent price advancement but raising questions about sustainability. The Average True Range (ATR) of 0.044 suggests elevated volatility expectations moving forward.
Overall Technical Picture: Bearish in the near-term due to extreme overbought conditions, despite underlying momentum indicators showing continued buying interest.
2. Multi-Source Sentiment Analysis
News Sentiment: The company enjoys overwhelmingly positive news coverage with a score of 0.39 across 18 analyzed articles, generating an overall impact rating of 0.19. Recent developments include strategic partnerships with Bollinger Shipyards for Neutron sea recovery platform enhancements and positive analyst commentary, including price target increases that reflect growing institutional confidence in the company’s technological capabilities and market positioning.
Social Media Sentiment: Social media platforms present a markedly different narrative, with a tepid sentiment score of 0.03 despite a 57.1% bullish ratio among 21 posts and 29,714 comments analyzed. The relatively low engagement on Wall Street Bets (10 mentions) and absence of unusual activity flags suggest retail investors lack strong conviction, creating a disconnect between professional and retail sentiment.
Insider Trading: The most alarming signal emerges from insider activity, with a massive net sale of -1,192,621 shares across 10 recent transactions. Notable transactions include CEO Peter Beck’s significant disposition and multiple sales by other executives, creating a highly bearish signal that directly contradicts the positive news sentiment.
Synthesis: The stark divergence between overwhelmingly positive news coverage and massive insider selling creates a troubling contradiction. While professional media outlets maintain optimism about the company’s prospects, those with the most intimate knowledge of operations are reducing their positions significantly, suggesting potential fundamental challenges not yet reflected in public analysis.
3. ML Model Prediction Evaluation
Both machine learning models converge on a bearish outlook, though with varying confidence levels that highlight the uncertainty surrounding RKLB’s near-term direction. The Random Forest model predicts a bearish trajectory with 38.0% probability of increase and 62.0% confidence in its directional call. The Ensemble model mirrors this bearish sentiment with identical 38.0% probability of increase but significantly lower confidence at just 24.0%.
The substantial difference in confidence levels between models (62.0% vs. 24.0%) indicates underlying data complexity and conflicting signals that challenge algorithmic interpretation. This disparity suggests the models are struggling to reconcile the positive fundamental developments with concerning technical and insider trading patterns.
The relatively low probability of increase (38.0%) across both models, combined with weak ensemble confidence, reinforces the bearish technical picture while acknowledging the probabilistic nature of these predictions. Investors should note that the low ensemble confidence particularly underscores the elevated uncertainty in current market conditions.
4. Market Positioning and Peer Comparison
RKLB demonstrates exceptional relative performance with +39.44% gains versus its sector, substantially outperforming traditional energy peers including Exxon Mobil (+0.84%), Chevron (+4.34%), ConocoPhillips (+0.76%), and Schlumberger (-1.87%). This outperformance reflects the market’s appetite for space technology exposure and differentiation from traditional energy sector dynamics.
Institutional ownership stands at a robust 54.0%, indicating significant professional investor confidence. Leading institutional holders include Zevenbergen Capital Investments LLC with 1,082,356 shares valued at $52.2 million, followed by Wealth Enhancement Advisory Services and various pension funds, suggesting long-term institutional commitment to the space technology thesis.
The moderate institutional ownership level provides adequate liquidity while avoiding the volatility extremes associated with either very low or very high institutional concentration. Market correlations show strong positive relationships with growth indices (QQQ: 0.678, SPY: 0.626) and notably negative correlation with the VIX (-0.566), suggesting the stock tends to perform well during periods of market optimism.
5. Risk Assessment and Position Sizing Recommendations
RKLB presents a high-risk investment profile with substantial volatility metrics that demand conservative position sizing. The Value at Risk calculation indicates potential daily losses of 8.50% at 95% confidence, reflecting the stock’s volatile nature and space sector dynamics.
Despite the elevated risk, the Sharpe ratio of 2.80 suggests historically strong risk-adjusted returns, though this metric should be viewed cautiously given the 88.0% annualized volatility. The Kelly Criterion recommends 0.0% position sizing, effectively suggesting complete avoidance due to the unfavorable risk-reward profile under current conditions.
The analysis recommends protective put strategies for existing shareholders, specifically purchasing put options 5-10% out of the money at a cost of 1-3% of position value. This hedging approach provides high effectiveness protection against the significant downside risks identified in the technical and insider trading analysis.
Conservative investors should limit exposure to 1-2% of portfolio value, while aggressive investors might consider up to 7-10% allocation, though such positions require robust risk management protocols including stop-loss orders and close monitoring of insider activity patterns.
6. Contrarian Signals or Crowded Trade Warnings
The analysis reveals significant sentiment divergences that could indicate contrarian opportunities or warn of potential reversal risks. The stark contrast between positive news sentiment (0.39) and massive insider selling (-1.2 million shares) suggests either market inefficiency or information asymmetry that could resolve in either direction.
The moderate institutional ownership (54.0%) combined with weak retail sentiment (0.03) indicates this is not currently a “crowded trade” from a positioning perspective. However, the extreme technical overbought conditions (RSI: 86.9) suggest potential for sharp reversals if momentum fails to sustain.
Social media sentiment remaining relatively neutral despite strong price performance could indicate either skepticism that proves prescient or create potential for positive surprise if fundamentals continue improving. The lack of unusual social media activity despite significant price gains suggests retail FOMO has not yet materialized, potentially providing upside catalyst if sentiment shifts.
7. Key Catalysts and Upcoming Events to Watch
Critical upcoming events include Neutron rocket development milestones and test flight schedules, which represent key technological and commercial catalysts for the company’s long-term prospects. Contract announcements, particularly government or large commercial partnerships, could significantly impact investor sentiment and stock performance.
Quarterly earnings reports warrant close attention given the current valuation levels and insider selling patterns. Any guidance revisions or operational updates could substantially influence the disconnect between positive news coverage and executive actions.
Regulatory developments in the space launch industry, competitive announcements from SpaceX or other rivals, and broader space technology sector sentiment shifts represent additional monitoring priorities. Changes in institutional positioning, particularly given the current 54.0% ownership level, could signal evolving professional investor sentiment.
8. Actionable Trading Strategy with Specific Levels
Short-Term Strategy (1-7 days): Given extreme overbought conditions and insider selling, recommend defensive positioning. Current resistance sits at $51.33 (current level), with immediate support expected near $44.60. A break below this level could trigger further declines toward the $39.00-$40.00 range.
Entry Strategy: Conservative traders should await pullback to $44.60 support level before considering long positions, with stop-loss placement below $39.00. Aggressive short-term traders might consider short positions above $51.33 with tight stops at $53.00, though this carries significant risk given the underlying momentum.
Medium-Term Strategy (1-3 months): The conflicting signals suggest a wait-and-see approach may be most prudent. If support holds at $44.60 and insider selling moderates, consider gradual accumulation with targets near $58-$60 based on Fibonacci extensions.
Exit Strategy: Existing shareholders should consider partial profit-taking at current levels given overbought conditions, while maintaining core positions if long-term space technology thesis remains intact. Implement trailing stops at 10-15% below recent highs to protect gains.
Overall Summary
RKLB presents a complex investment scenario characterized by conflicting signals that demand cautious analysis and conservative positioning. The stock exhibits a Neutral to Bearish short-term outlook driven by extreme overbought technical conditions and concerning insider selling patterns, despite positive news sentiment and strong relative performance.
For medium-term perspectives, the outlook remains Uncertain as positive fundamental developments in space technology and strategic partnerships conflict with concerning insider activity and elevated valuation metrics. Key factors crucial for monitoring include resolution of the insider selling activity, technical oversold bounce potential, and execution on Neutron rocket development milestones.
The analysis emphasizes the need for highly conservative position sizing given the elevated volatility profile and conflicting sentiment signals. Effective business leadership often requires the same analytical rigor and strategic communication skills essential for navigating complex market conditions, where executive presence and clear performance metrics guide decision-making processes. Professional training in risk assessment and presentation of complex data becomes crucial when managing high-stakes situations that demand both analytical depth and confident execution under uncertainty.
The space technology sector continues attracting institutional capital despite individual company volatilities, suggesting long-term growth prospects remain intact while short-term price discovery continues evolving through technical and fundamental catalysts.
MACHINE LEARNING PREDICTIONS:
—————————————-
RANDOM FOREST:
• Direction: 📉 BEARISH
• Probability of Increase: 38.0%
• Confidence Level: 62.0%

ENSEMBLE:
• Direction: 📉 BEARISH
• Probability of Increase: 38.0%
• Confidence Level: 24.0%
MARKET POSITIONING & ANALYSIS:
—————————————-
Institutional Ownership: 54.0%
Performance vs Sector: +39.44%
Target Performance: +40.46%
📊 Market Correlations:
• SPY (S&P 500): 0.626
• QQQ (NASDAQ): 0.678
• DIA (Dow Jones): 0.561
• VIX (Volatility): -0.566

