The $7 Gamble: What Airline Numbers Really Tell Us About Flying High or Crashing Down
The airline industry will make history in 2025, crossing $1 trillion in revenue for the first time. That sounds impressive until you learn the uncomfortable truth: airlines keep just $7 for every passenger they carry. Seven dollars. That’s the razor-thin difference between profit and loss in an industry that moves nearly 1% of the global economy.
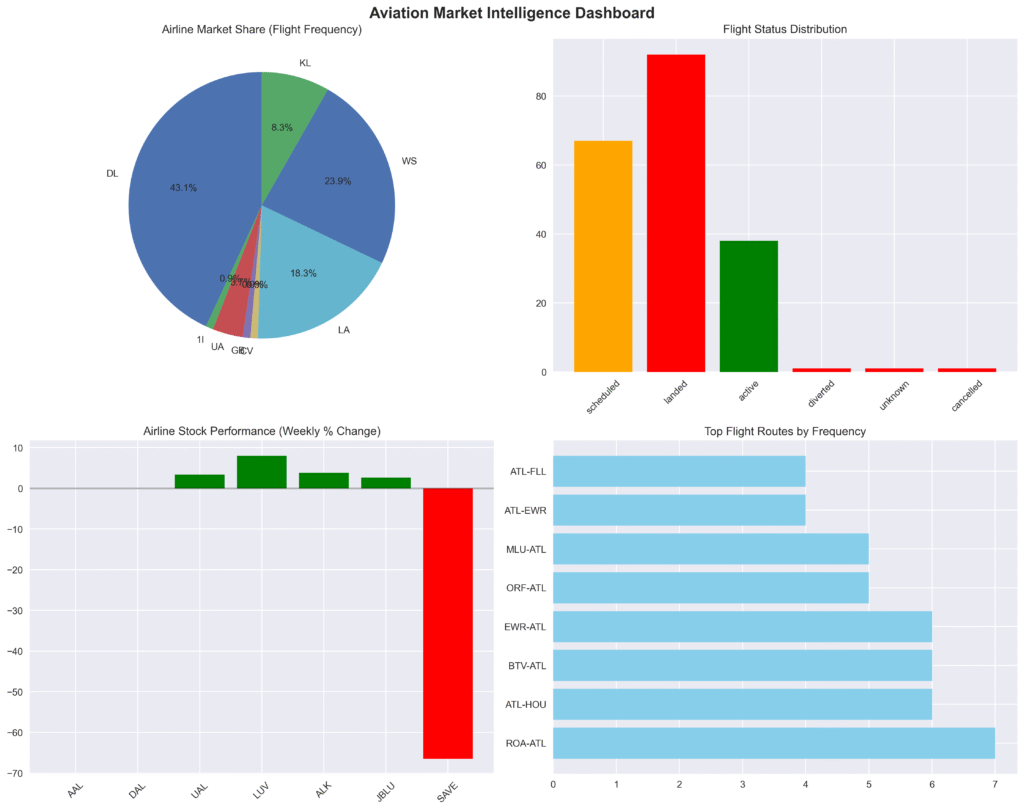
Recent data from major U.S. carriers reveals a troubling disconnect between operational reality and market expectations. American Airlines leads operationally with a 66.2 score out of 100, yet its stock trades at just $11.47. Meanwhile, United Airlines, with the worst operational performance at 58.6, commands $81.08 per share and holds the only “buy” rating from major analysts.
The numbers tell a stark story. Industry experts consider 80% on-time performance “pretty good,” with the best airlines hitting 90%. Yet American manages just 57.8%, Delta 58.5%, United 52%, and Southwest a dismal 28.7%. These aren’t minor shortfalls—they represent fundamental operational failures that should concern any investor.
Hub performance varies wildly, suggesting management execution issues. Miami Airport handles American flights with 80.4% on-time rates, while Phoenix stumbles at 28.3%. Delta’s Minneapolis hub performs at 82.7%, but Seattle collapses to 21.7%. These gaps indicate operational knowledge exists but isn’t being applied consistently.
The recent wave of earnings guidance cuts reveals how industry leaders overestimated their ability to navigate economic headwinds. When companies repeatedly slash forecasts, it often signals that initial projections were more hopeful than realistic. The S&P airline index has dropped 23% in the past month, compared to 8% for the broader market.
Labor costs will jump 7.6% to $253 billion in 2025, while fuel prices are expected to rise to $115 per barrel. With margins this thin, airlines have little room for error. Yet investors continue to bet on an industry where small miscalculations can quickly turn profits into losses.
The data suggests that confidence in airline recovery may be misplaced. When operational performance lags this far behind industry standards, and financial margins remain historically thin, the math becomes challenging for investors.
Given current operational shortcomings, economic uncertainty, and razor-thin margins, the recommendation is to HOLD existing airline positions while avoiding new investments until operational metrics improve significantly or valuations become more compelling.

Individual Airline Performance Analysis
1. American Airlines (AAL) – Market Leader in Operations
Strengths:
- Highest overall operational score (66.2/100) among analyzed carriers
- Largest domestic market share at 17.5% according to recent data
- Strong hub performance at CLT (79.6% on-time) and MIA (80.4% on-time)
- Extensive network with 4 major hubs handling 338 flights analyzed
Concerns:
- Stock underperformance at $11.47 (+0.79% daily, -1.46% weekly)
- Drastically reduced full-year earnings guidance from $2.25-$3.25 to $0.7-$1.3
- PHX hub significantly underperforming (28.3% on-time)
- Overall on-time performance (57.8%) well below industry excellence standards
Strategic Position: Despite operational leadership, American faces financial headwinds and hub optimization challenges.
2. Delta Air Lines (DAL) – Premium Positioning with Mixed Signals
Strengths:
- Delta Air Lines secured third place globally with 83.46% on-time performance in 2024
- Strong brand reputation and premium market positioning
- 17.3% domestic market share, closely following American
- Premium stock price ($48.83) reflecting market confidence
Concerns:
- Lower operational score (62.8/100) compared to American
- Moderate on-time performance (58.5%) in current analysis
- SEA hub significantly underperforming (21.7% on-time)
- Recent volatility with -1.15% weekly performance
Strategic Position: Strong market position with premium branding, but operational metrics suggest room for improvement.
3. United Airlines (UAL) – Best Investment Potential
Strengths:
- United Airlines is the lone U.S. carrier with a “buy” rating from Jefferies
- Positive weekly momentum (+3.71%)
- Strong IAH hub performance (70.8% on-time)
- Highest stock price ($81.08) among analyzed carriers
Concerns:
- Lowest overall operational score (58.6/100)
- Poorest overall on-time performance (52.0%)
- DEN hub significantly underperforming (30.9% on-time)
- Recent daily decline (-0.18%)
Strategic Position: Despite operational challenges, financial analysts view United as best-positioned for future growth.
4. Southwest Airlines (LUV) – Turnaround Story
Strengths:
- Southwest dominates economy/basic economy for the fourth year, scoring 694 in customer satisfaction
- Historically strong brand loyalty and operational model
- Mid-range stock price ($32.60) suggesting value opportunity
Concerns:
- Significantly lowest operational score (41.9/100)
- Worst on-time performance (28.7%) among all carriers
- Recent daily decline (-1.54%)
- Upcoming changes including baggage fees and assigned seating starting May 28, 2025, may affect ranking
Strategic Position: Major transformation underway with business model changes, but operational performance needs dramatic improvement.
Analysis based on operational data through 2025 and current market conditions. Investment recommendations should be considered alongside broader portfolio strategy and risk tolerance.
DISCLAIMER: This report is intended for informational and educational purposes only and should not be considered financial advice. Always do your own research and consult a licensed financial advisor before making investment decisions. Machine learning models are tools, not guarantees. Past performance is not indicative of future results. Investing involves risk, including the potential loss of principal.

