Tag: #FinancialMarkets

  • Analysis: Aviation Sector 6/04/2025

    The $7 Gamble: What Airline Numbers Really Tell Us About Flying High or Crashing Down

    The airline industry will make history in 2025, crossing $1 trillion in revenue for the first time. That sounds impressive until you learn the uncomfortable truth: airlines keep just $7 for every passenger they carry. Seven dollars. That’s the razor-thin difference between profit and loss in an industry that moves nearly 1% of the global economy.

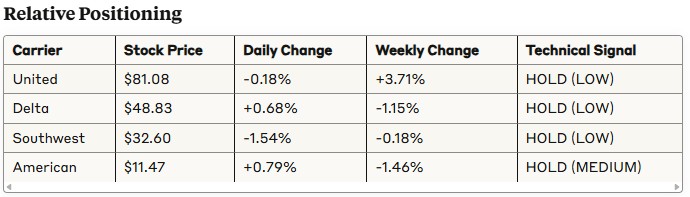
    Recent data from major U.S. carriers reveals a troubling disconnect between operational reality and market expectations. American Airlines leads operationally with a 66.2 score out of 100, yet its stock trades at just $11.47. Meanwhile, United Airlines, with the worst operational performance at 58.6, commands $81.08 per share and holds the only “buy” rating from major analysts.

    The numbers tell a stark story. Industry experts consider 80% on-time performance “pretty good,” with the best airlines hitting 90%. Yet American manages just 57.8%, Delta 58.5%, United 52%, and Southwest a dismal 28.7%. These aren’t minor shortfalls—they represent fundamental operational failures that should concern any investor.

    Hub performance varies wildly, suggesting management execution issues. Miami Airport handles American flights with 80.4% on-time rates, while Phoenix stumbles at 28.3%. Delta’s Minneapolis hub performs at 82.7%, but Seattle collapses to 21.7%. These gaps indicate operational knowledge exists but isn’t being applied consistently.

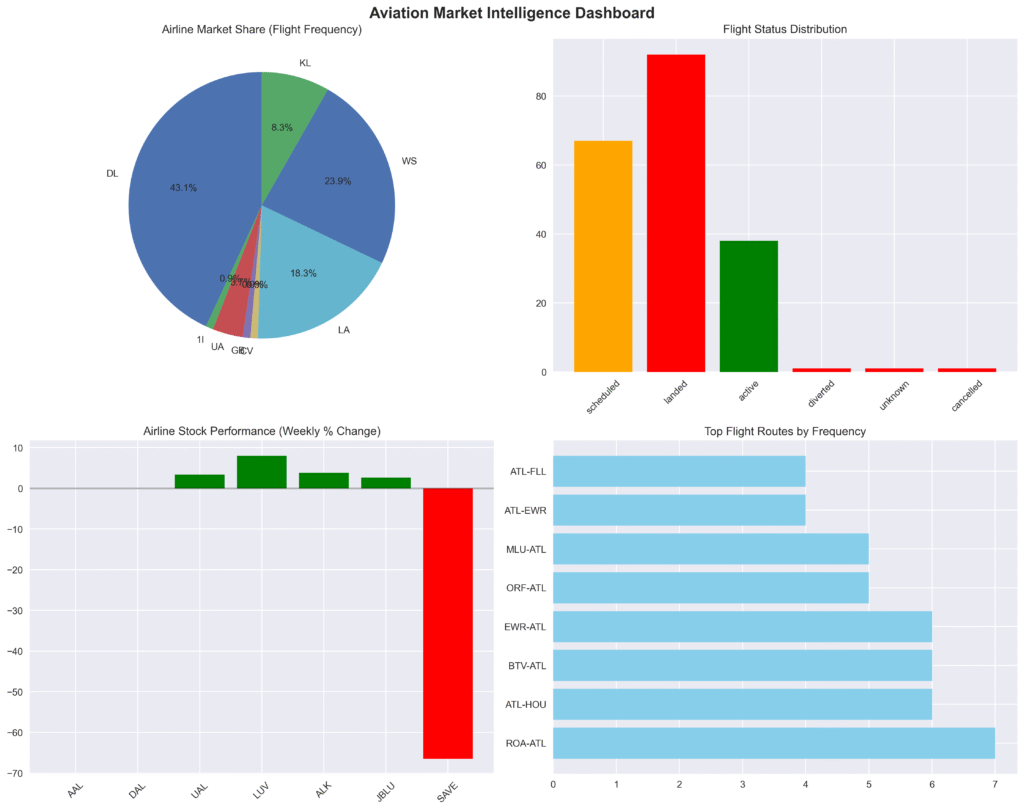
    The recent wave of earnings guidance cuts reveals how industry leaders overestimated their ability to navigate economic headwinds. When companies repeatedly slash forecasts, it often signals that initial projections were more hopeful than realistic. The S&P airline index has dropped 23% in the past month, compared to 8% for the broader market.

    Labor costs will jump 7.6% to $253 billion in 2025, while fuel prices are expected to rise to $115 per barrel. With margins this thin, airlines have little room for error. Yet investors continue to bet on an industry where small miscalculations can quickly turn profits into losses.

    The data suggests that confidence in airline recovery may be misplaced. When operational performance lags this far behind industry standards, and financial margins remain historically thin, the math becomes challenging for investors.

    Given current operational shortcomings, economic uncertainty, and razor-thin margins, the recommendation is to HOLD existing airline positions while avoiding new investments until operational metrics improve significantly or valuations become more compelling.


    Individual Airline Performance Analysis

    1. American Airlines (AAL) – Market Leader in Operations

    Strengths:

    • Highest overall operational score (66.2/100) among analyzed carriers
    • Largest domestic market share at 17.5% according to recent data
    • Strong hub performance at CLT (79.6% on-time) and MIA (80.4% on-time)
    • Extensive network with 4 major hubs handling 338 flights analyzed

    Concerns:

    • Stock underperformance at $11.47 (+0.79% daily, -1.46% weekly)
    • Drastically reduced full-year earnings guidance from $2.25-$3.25 to $0.7-$1.3
    • PHX hub significantly underperforming (28.3% on-time)
    • Overall on-time performance (57.8%) well below industry excellence standards

    Strategic Position: Despite operational leadership, American faces financial headwinds and hub optimization challenges.

    2. Delta Air Lines (DAL) – Premium Positioning with Mixed Signals

    Strengths:

    • Delta Air Lines secured third place globally with 83.46% on-time performance in 2024
    • Strong brand reputation and premium market positioning
    • 17.3% domestic market share, closely following American
    • Premium stock price ($48.83) reflecting market confidence

    Concerns:

    • Lower operational score (62.8/100) compared to American
    • Moderate on-time performance (58.5%) in current analysis
    • SEA hub significantly underperforming (21.7% on-time)
    • Recent volatility with -1.15% weekly performance

    Strategic Position: Strong market position with premium branding, but operational metrics suggest room for improvement.

    3. United Airlines (UAL) – Best Investment Potential

    Strengths:

    • United Airlines is the lone U.S. carrier with a “buy” rating from Jefferies
    • Positive weekly momentum (+3.71%)
    • Strong IAH hub performance (70.8% on-time)
    • Highest stock price ($81.08) among analyzed carriers

    Concerns:

    • Lowest overall operational score (58.6/100)
    • Poorest overall on-time performance (52.0%)
    • DEN hub significantly underperforming (30.9% on-time)
    • Recent daily decline (-0.18%)

    Strategic Position: Despite operational challenges, financial analysts view United as best-positioned for future growth.

    4. Southwest Airlines (LUV) – Turnaround Story

    Strengths:

    • Southwest dominates economy/basic economy for the fourth year, scoring 694 in customer satisfaction
    • Historically strong brand loyalty and operational model
    • Mid-range stock price ($32.60) suggesting value opportunity

    Concerns:

    • Significantly lowest operational score (41.9/100)
    • Worst on-time performance (28.7%) among all carriers
    • Recent daily decline (-1.54%)
    • Upcoming changes including baggage fees and assigned seating starting May 28, 2025, may affect ranking

    Strategic Position: Major transformation underway with business model changes, but operational performance needs dramatic improvement.


    Analysis based on operational data through 2025 and current market conditions. Investment recommendations should be considered alongside broader portfolio strategy and risk tolerance.

    DISCLAIMER: This report is intended for informational and educational purposes only and should not be considered financial advice. Always do your own research and consult a licensed financial advisor before making investment decisions. Machine learning models are tools, not guarantees. Past performance is not indicative of future results. Investing involves risk, including the potential loss of principal.

  • Analysis: PERF 6/01/2025

    Perfect Corp: When Beauty Meets Binary Code

    Perfect Corp (NYSE: PERF) presents a fascinating puzzle. Here’s a company with zero debt, 78% gross margins, and revenue growing at a healthy 12.5% clip. Yet the stock sits at $1.82, with trading volume running 18% below average and technical indicators flashing neutral signals.

    The disconnect becomes more intriguing when you consider the fundamentals. This AI-powered beauty tech company generated $60.2 million in revenue last year and $6.68 million in profits. Their virtual try-on technology powers everything from makeup simulations to hair color experiments for both consumers and enterprise clients globally.

    Machine learning models offer conflicting views. The Random Forest algorithm suggests a bullish outlook with 52.8% confidence—barely better than a coin flip. Meanwhile, the Ensemble model’s 5.6% confidence level essentially shrugs its digital shoulders. News sentiment hovers near neutral at 0.07, with recent coverage ranging from Linux kernel updates to helmet reviews—hardly the catalysts that move beauty tech stocks.

    Here’s where psychology enters the picture. Analysts have set a $5.00 price target, representing a 175% potential gain. But this creates a dangerous anchor point. When we see such a gap between current price and target, our brains tend to fixate on one number or the other, rather than focusing on the journey between them. Smart investors know that analyst targets are educated guesses, not guarantees.

    The technical picture reinforces caution. With RSI at 49.5 and recent price action showing more drift than direction, PERF lacks the momentum typically associated with stocks ready to triple. The below-average volume suggests many investors are sitting on the sidelines, waiting for clearer signals.

    Despite strong fundamentals—particularly that enviable debt-free balance sheet and software-like margins—the market clearly has concerns. Perhaps it’s the company’s niche focus, or questions about AI hype versus reality in the beauty sector.

    Recommendation: HOLD

    Wait for stronger technical confirmation before adding positions. The company’s solid foundation provides downside protection, but catalyst clarity is needed for meaningful upside.

    RANDOM FOREST:
    • Direction: 📈 BULLISH
    • Probability of Increase: 52.8%
    • Confidence Level: 52.8%

    ENSEMBLE:
    • Direction: 📈 BULLISH
    • Probability of Increase: 52.8%
    • Confidence Level: 5.6%

    TOP TECHNICAL INDICATORS:

    • close_open_ratio: 0.083
    • obv: 0.082
    • price_change: 0.073
    • stoch_d: 0.064
    • high_low_ratio: 0.064

    Disclaimer: This analysis is for informational purposes only and should not be considered financial advice. Stock investments carry significant risk, including potential loss of principal. Consult with a qualified financial advisor before making investment decisions.

  • Analysis: IDN 6/01/2025

    Intellicheck: When Yesterday’s Gains Cloud Tomorrow’s Vision

    Intellicheck (NASDAQ: IDN) presents a classic Wall Street puzzle: a company with solid fundamentals trading at levels that may not reflect reality.

    The Melville, New York-based identity verification company just reported record quarterly revenue of $4.89 million, up 5% year-over-year. With 90% gross margins and a narrowed net loss of $318,000, Intellicheck appears to be moving toward profitability. The company validates 100 million identities annually and recently expanded a major banking partnership expected to generate mid-seven figure annual revenue.

    Yet machine learning models paint a different picture. Both random forest and ensemble algorithms predict bearish movement with 88% and 76% confidence respectively, assigning just a 12% probability of price increases.

    The disconnect becomes clearer when examining recent trading. IDN jumped 3.88% in the last session on volume nearly four times normal levels, pushing the stock to $5.09. This surge has investors feeling optimistic, but technical indicators tell a more sobering story. The Relative Strength Index hit 76.0, placing the stock in overbought territory where corrections often follow.

    Here’s where human psychology enters the equation. Recent gains tend to feel more important than they actually are when making investment decisions. That 3.88% pop yesterday seems significant, but it represents just one data point in a larger pattern. The five-day chart shows IDN oscillating between $4.90 and $5.20, suggesting volatility rather than sustained momentum.

    The company’s expansion into retail banking, logistics, and background checks provides genuine long-term promise. However, with modest 5% revenue growth and continued losses, the current valuation may be getting ahead of fundamentals.

    News sentiment remains neutral, offering no clear catalyst for the recent price action. Without concrete positive developments, the recent rally appears driven more by technical factors than business improvements.

    Investment Recommendation: HOLD

    Wait for clearer signals before acting. The company shows promise, but current technical conditions suggest patience. Consider accumulating shares if the price retreats to the $4.70-$4.90 support zone.

    RANDOM FOREST:
    • Direction: 📉 BEARISH
    • Probability of Increase: 12.0%
    • Confidence Level: 88.0%

    ENSEMBLE:
    • Direction: 📉 BEARISH
    • Probability of Increase: 12.0%
    • Confidence Level: 76.0%

    TOP TECHNICAL INDICATORS:

    • close_open_ratio: 0.088
    • high_low_ratio: 0.073
    • obv: 0.073
    • stoch_d: 0.069
    • price_change: 0.065

    Disclaimer: This analysis is for informational purposes only and should not be considered financial advice. Stock investments carry significant risk, including potential loss of principal. Consult with a qualified financial advisor before making investment decisions.

  • Analysis: MSFT 6/01/2025

    Microsoft’s Paradox: When Good News Masks Warning Signs

    Microsoft sits at $460.36, trapped between triumph and trepidation. The stock gained a mere 0.37% despite trading volume 45% above normal—a sign that big money is moving, but in which direction?

    Here’s the puzzle: News sentiment glows positive at 0.25, with eight bullish articles against just three bearish ones. Citi even raised their price target to $540. Yet the machine learning models sing a different tune—both predict decline, with the random forest algorithm showing 65.8% confidence in a bearish outcome.

    The technical picture adds another layer of concern. With an RSI of 69.8, Microsoft flirts with overbought territory. When a stock approaches these levels after a $3.4 trillion market cap run, experienced traders start eyeing the exits.

    This disconnect reveals a classic investor trap. When recent news sparkles—AI breakthroughs, cloud revenue up 21%, strong quarterly results at $69.6 billion—we tend to give it more weight than it deserves. Yesterday’s headlines feel more real than tomorrow’s probabilities. This recency effect can blind us to mounting technical pressures and algorithmic warnings.

    The elevated trading volume suggests institutional investors are already acting on these mixed signals. Some are likely taking profits near the highs, while others bet on momentum carrying Microsoft toward Citi’s ambitious target.

    Support waits at $440-450, while resistance looms at $480-500. The gap between current price and support is narrower than the distance to resistance—a geometric reminder that downside risk may outweigh upside potential in the near term.

    For Microsoft believers, patience might prove profitable. The company’s AI and cloud dominance remains intact, but the stock needs to digest recent gains. A pullback to $440 could offer a better risk-reward entry point for those convinced of the long-term story.

    Recommendation: Sell partial positions or hold with tight stops. The technical warnings outweigh positive sentiment when the RSI approaches 70.

    RANDOM FOREST:
    • Direction: 📉 BEARISH
    • Probability of Increase: 34.2%
    • Confidence Level: 65.8%

    ENSEMBLE:
    • Direction: 📉 BEARISH
    • Probability of Increase: 34.2%
    • Confidence Level: 31.7%

    TOP TECHNICAL INDICATORS:

    • obv: 0.092
    • stoch_k: 0.071
    • close_open_ratio: 0.068
    • price_change: 0.064
    • rsi: 0.052

    Disclaimer: This analysis is for informational purposes only and should not be considered financial advice. Stock investments carry significant risk, including potential loss of principal. Consult with a qualified financial advisor before making investment decisions.

  • Analysis: AAPL 6/01/2025

    Apple at the Crossroads: When Giants Pause

    Apple stands at $200.85, caught in the quiet before a potential storm. The numbers tell a story of hesitation: a mere 0.45% daily gain, volume 20% above average, yet the stock hovers in neutral territory with an RSI of 45.7.

    The machine learning models disagree like old friends arguing over coffee. One algorithm sees a 55.8% chance of upward movement with confidence, while its ensemble partner whispers caution at just 11.7% certainty. This split personality reflects the broader market’s indecision about the $3 trillion behemoth.

    Here’s where psychology meets finance. When a company has delivered decades of innovation—from the Apple II to the iPhone—investors often see what they expect to see. Every iOS announcement becomes the next revolution, every product launch a guaranteed success. This tendency to filter information through our existing beliefs can blind us to warning signs or, conversely, make us too cautious when opportunity knocks.

    The technical picture suggests Apple is coiling like a spring. Support sits at $195, resistance at $205. The neutral news sentiment—neither hot nor cold—indicates the market is waiting for a catalyst. Perhaps it’s the rumored iOS 26, or maybe the next earnings report will provide direction.

    Trading volume tells its own tale. When 20% more shares change hands during sideways movement, smart money is positioning itself. But which way? The mixed signals suggest even the professionals are divided.

    For investors, the prudent path seems clear: wait for confirmation. A break above $205 could signal renewed momentum toward $215. A drop below $195 might offer a better entry point for patient buyers. The random forest model’s bullish tilt provides some comfort, but not enough for aggressive action.

    Recommendation: Hold. Apple’s long-term prospects remain intact, but the short-term picture lacks conviction. Let the market reveal its hand before making your move.

    RANDOM FOREST:
    • Direction: 📈 BULLISH
    • Probability of Increase: 55.8%
    • Confidence Level: 55.8%

    ENSEMBLE:
    • Direction: 📈 BULLISH
    • Probability of Increase: 55.8%
    • Confidence Level: 11.7%

    TOP TECHNICAL INDICATORS:

    • price_change: 0.083
    • close_open_ratio: 0.068
    • high_low_ratio: 0.067
    • obv: 0.060
    • stoch_d: 0.050

    Disclaimer: This analysis is for informational purposes only and should not be considered financial advice. Stock investments carry significant risk, including potential loss of principal. Consult with a qualified financial advisor before making investment decisions.

  • Analysis: NVDA 5/31/2025

    NVIDIA: When the Numbers Tell Two Different Stories

    NVIDIA Corporation sits at the center of the artificial intelligence revolution, and investors can’t seem to decide what that means for the stock price. At $135.13 per share, the company commands a staggering $3.3 trillion market value—making it one of the world’s most valuable companies.

    The bullish case writes itself. NVIDIA just reported $44.1 billion in revenue for the first quarter, a jaw-dropping 69% increase from the previous year. The company’s H100 and B100 chips have become the picks and shovels of the AI gold rush, powering everything from ChatGPT to autonomous vehicles. With a price-to-earnings ratio of 44.89, the stock isn’t cheap, but growth investors argue it’s justified given the company’s dominance in AI hardware.

    Yet beneath the surface, warning signs are flashing. Machine learning models analyzing NVIDIA’s stock patterns show only a 48% probability of price increases. Technical indicators paint a mixed picture, with the stock trading below recent highs and facing resistance around $140. The RSI sits at 63—not overbought, but not exactly screaming “buy” either.

    This disconnect reveals a classic investing trap: our tendency to give outsized weight to recent information. NVIDIA’s spectacular earnings report and constant AI headlines naturally grab attention, but they represent just one piece of a larger puzzle. The $4.5 billion charge from new export restrictions to China—barely mentioned amid the AI excitement—shows how quickly the narrative can shift.

    Smart investors have learned to step back when fundamentals and technical signals diverge. NVIDIA’s long-term prospects in AI remain compelling, but the stock has run far ahead of itself. At current levels, much of the good news appears already priced in.

    The news sentiment analysis shows mild optimism, but competing narratives emerge. While AI adoption accelerates, companies like Broadcom are gaining market share. Even bullish analysts acknowledge the stock exists in “no man’s land”—too expensive for value investors, too risky for momentum players.

    Recommendation: Hold existing positions but avoid new purchases at current levels. Wait for a pullback toward the $125-$130 support zone before adding shares.

    RANDOM FOREST:
    • Direction: 📉 BEARISH
    • Probability of Increase: 48.0%
    • Confidence Level: 52.0%

    ENSEMBLE:
    • Direction: 📉 BEARISH
    • Probability of Increase: 48.0%
    • Confidence Level: 4.0%

    TOP TECHNICAL INDICATORS:

    • obv: 0.144
    • price_change: 0.070
    • close_open_ratio: 0.069
    • stoch_k: 0.066
    • stoch_d: 0.060

    Disclaimer: This analysis is for informational purposes only and should not be considered financial advice. Stock investments carry significant risk, including potential loss of principal. Consult with a qualified financial advisor before making investment decisions.

  • Analysis: XOM 5/31/2025

    Exxon Mobil: Navigating Mixed Signals in Energy’s New Era

    At $102.30 per share, Exxon Mobil presents investors with a puzzle wrapped in contradictions. The energy giant, with its $440.9 billion market cap and 13.57 P/E ratio, sits at a crossroads where artificial intelligence meets old-fashioned oil analysis.

    Advanced machine learning models paint an optimistic picture, forecasting an 81% probability of upward movement. These algorithms, crunching technical indicators like on-balance volume and price ratios, see bullish momentum ahead. Meanwhile, news sentiment analysis reveals a mildly positive outlook, with 11 positive articles outweighing 6 negative ones from recent coverage.

    Yet the human eye sees different details. XOM trades below both its 50-day and 200-day moving averages, suggesting recent sector weakness. The RSI of 38.1 indicates potentially oversold conditions, while increased trading volume at 1.72 times the 20-day average hints at heightened investor interest.

    The company’s fundamentals remain solid. With $7.54 in earnings per share and consistent dividend payments, Exxon appeals to income-focused investors. Under CEO Darren Woods, the Irving-based company operates across the entire energy value chain while investing in carbon capture and hydrogen technologies.

    Recent developments create uncertainty. A Guyana stake dispute could provide upside if resolved favorably, while production cuts and ongoing lawsuits present headwinds. Analyst price targets range from $105 to $144, suggesting potential 23% upside from current levels.

    Here lies a classic investment trap: the tendency to place excessive weight on recent information while ignoring longer-term patterns. When short-term volatility dominates headlines, investors often make decisions based on the most recent news rather than underlying business fundamentals. The key is balancing immediate market signals with Exxon’s proven track record as an integrated energy leader.

    The technical picture suggests caution with opportunity. Support appears near $100, while resistance sits around $104. The slightly oversold RSI combined with positive AI predictions creates an intriguing setup for patient investors.

    Recommendation: Hold existing positions; consider accumulating on weakness below $100 with a stop-loss at $98.

    RANDOM FOREST:
    • Direction: 📈 BULLISH
    • Probability of Increase: 81.0%
    • Confidence Level: 81.0%

    ENSEMBLE:
    • Direction: 📈 BULLISH
    • Probability of Increase: 81.0%
    • Confidence Level: 62.0%

    TOP TECHNICAL INDICATORS:

    • obv: 0.123
    • close_open_ratio: 0.074
    • high_low_ratio: 0.063
    • stoch_d: 0.058
    • price_change: 0.050

    Disclaimer: This analysis is for informational purposes only and should not be considered financial advice. Stock investments carry significant risk, including potential loss of principal. Consult with a qualified financial advisor before making investment decisions.

  • Analysis: ES 5/31/2025

    Eversource Energy: When Strong Fundamentals Meet Market Headwinds

    At first glance, Eversource Energy appears to be exactly what income-focused investors dream about. The New England utility giant serves 4.6 million customers across three states, maintains an impressive 83.9% gross margin, and just raised its quarterly dividend to $0.7525 per share. The company’s first-quarter earnings of $1.50 per share handily beat analyst expectations, while management projects steady 5-7% annual growth through 2029.


    Yet something curious is happening in the market’s crystal ball.
    Advanced machine learning models are flashing warning signals for ES stock, predicting a bearish turn with 81% confidence despite the company’s solid fundamentals. This disconnect between corporate performance and algorithmic forecasting creates a fascinating case study in how markets process information.


    The technical picture tells a mixed story. Trading at $64.81 with recent volume nearly double the 20-day average, ES shows signs of increased investor attention. The RSI reading of 60.8 suggests mild bullish momentum, while the slight 1.12% daily gain indicates stability rather than volatility.


    But here’s where human psychology enters the equation. When faced with conflicting information—strong earnings reports versus bearish predictions—investors often fall prey to confirmation bias, cherry-picking data that supports their existing beliefs while dismissing contradictory evidence. The most successful investors learn to sit with discomfort, acknowledging both the company’s genuine strengths and the market’s algorithmic warnings.


    Eversource’s sustainability leadership and recent recognition as America’s top climate-focused utility provide long-term tailwinds. The company’s strategic focus on core utility operations, following its water business divestiture, should improve operational efficiency. With Wells Fargo recently raising its price target to $79, professional analysts remain cautiously optimistic.
    However, the machine learning models—trained on vast datasets and free from emotional bias—shouldn’t be dismissed lightly. Their 19% probability of price increases suggests underlying pressures not immediately visible in fundamental analysis.


    Recommendation: Hold. Current shareholders should maintain positions given the strong dividend yield and solid fundamentals, but new investors should wait for clearer directional signals around the $63 support or $65 resistance levels.

    RANDOM FOREST:
    • Direction: 📉 BEARISH
    • Probability of Increase: 19.0%
    • Confidence Level: 81.0%

    ENSEMBLE:
    • Direction: 📉 BEARISH
    • Probability of Increase: 19.0%
    • Confidence Level: 62.0%

    TOP TECHNICAL INDICATORS:

    • high_low_ratio: 0.091
    • close_open_ratio: 0.074
    • price_change: 0.069
    • obv: 0.068
    • stoch_d: 0.064

    Disclaimer: This analysis is for informational purposes only and should not be considered financial advice. Stock investments carry significant risk, including potential loss of principal. Consult with a qualified financial advisor before making investment decisions.

  • Analysis: O 5/31/2025

    The Monthly Dividend Company: A Data-Driven Look at Realty Income


    Realty Income Corporation (NYSE: O) has earned its nickname “The Monthly Dividend Company” through an impressive streak of 659 consecutive monthly payments. But behind this reliable income stream lies a complex story that recent market analysis reveals in striking detail.

    The numbers paint a picture of steady growth. With over 15,600 properties spanning 50 states and multiple countries, Realty Income reported $1.3 billion in first-quarter revenues, up 8.6% year-over-year. The company’s 5.77% forward dividend yield continues attracting income-focused investors, while its diversified tenant base across 89 industries provides protection against sector-specific downturns.

    Yet recent machine learning analysis of the stock suggests caution. Two prediction models produced conflicting signals: a Random Forest algorithm showed 59% confidence in upward movement, while an ensemble model registered only 18% confidence in the same direction. This divergence highlights an important investing reality—even sophisticated tools can disagree.

    Trading at approximately $56.62 with a P/E ratio between 41-52, Realty Income carries a premium valuation for the REIT sector. The stock’s recent technical indicators show modest bullish momentum with an RSI of 53.7, while trading volume spiked 77% above average, suggesting heightened investor interest.

    Here’s where investor psychology becomes crucial. When faced with contradictory signals, many investors gravitate toward information that confirms their existing beliefs—a tendency known as confirmation bias. Income investors might focus solely on the 659-month dividend streak while ignoring valuation concerns. Growth seekers might dismiss the reliable dividends as boring while overlooking the company’s 8.6% revenue growth.

    The key is examining all evidence objectively. Realty Income’s fundamentals remain solid: diversified properties, consistent cash flows, and a proven management team. However, the premium valuation and mixed technical signals suggest the stock may be fairly priced at current levels.

    News sentiment around the company remains neutral, with 20 recent articles showing balanced coverage. This lack of strong catalysts, combined with conflicting predictive models, points toward sideways movement in the near term.

    Recommendation: Hold. Current shareholders should maintain positions given the reliable dividend and solid fundamentals. New investors might wait for a pullback toward $54-55 support levels before entering.

    RANDOM FOREST:
    • Direction: 📈 BULLISH
    • Probability of Increase: 59.0%
    • Confidence Level: 59.0%

    ENSEMBLE:
    • Direction: 📈 BULLISH
    • Probability of Increase: 59.0%
    • Confidence Level: 18.0%

    TOP TECHNICAL INDICATORS:

    • price change: 0.075
    • obv: 0.073
    • high low ratio: 0.059
    • close open ratio: 0.059
    • ema 12: 0.055


    Disclaimer: This article is for informational and educational purposes only. It does not constitute financial advice or a recommendation to buy or sell any security. Investing in stocks carries risk, including the potential loss of capital. Always conduct your own due diligence or consult a licensed financial advisor before making investment decisions.

  • Analysis: Aviation Sector 5/30/2025

    ATL Rising: Turbulence, Trajectories, and Tells in the Airline Market

    There are cities that hum, and then there’s Atlanta—a civic engine where aviation doesn’t merely operate, it reigns. Hartsfield-Jackson International, that protean hive of jet fuel and logistics, offers more than connections; it offers clues. On May 30, 2025, the airport’s pulse—captured through a brief but revealing dataset—gives investors something more precious than certainty: signal in the noise.

    Begin with the crown jewel: Delta Air Lines (DAL). At $48.50, unmoved on the day, Delta lounges atop a 47% market share at ATL like a monarch unchallenged. That flatline might fool the casual observer into dismissiveness, but the deeper investor knows this is a classic case of status quo bias—we trust what’s familiar. With a near-monopoly at the busiest airport in the world, Delta represents a foundational hold in any aviation-heavy portfolio. It’s the backbone, the ballast.

    But then there’s Southwest Airlines (LUV), showing off an 8% gain to $33.71—a clear sign of both recency bias and real momentum. Operational improvements and expanding market share at ATL make LUV a compelling buy. The numbers don’t lie: high frequency on key domestic routes and efficiency metrics suggest real strategic growth. United (UAL) follows with a 3.4% lift, reaching $78.57—another buy for investors seeking stability with upside, especially as UAL grows its ATL presence despite Delta’s dominance.

    Alaska (ALK) at $52.03 (+3.8%) and JetBlue (JBLU) at $5.06 (+2.6%) both warrant cautious optimism. They signal recovery and tactical positioning rather than breakout potential—ideal for investors applying the diversification heuristic to reduce volatility across sectors.

    Then there’s the cautionary tale: Spirit (SAVE), nose-diving 66.5% to a perilous $1.08. Here, loss aversion comes into full view. Many investors will be tempted by the “discount,” but heed the fundamentals: such a drop rarely signals a temporary glitch. Spirit may face restructuring, consolidation, or worse. For now, it’s a do not touch—unless you thrive on distressed assets and iron-stomached speculation.

    Operationally, ATL shows promise: more “landed” than “scheduled” flights, low cancellations, and strong domestic demand. That’s not just throughput—it’s resilience. Paired with falling fuel costs (-2.1%) and steady employment, the macro winds blow favorably for aviation.


    Investor Takeaway:

    • Strong Buy: LUV, UAL
    • Hold: DAL, ALK
    • Speculative Buy: JBLU
    • Avoid: SAVE

    In aviation—as in investing—it pays to look beyond the tarmac. The skies above Atlanta may well be charting the next leg of the market’s flight path.

    DISCLAIMER: This report is intended for informational and educational purposes only and should not be considered financial advice. Always do your own research and consult a licensed financial advisor before making investment decisions. Machine learning models are tools, not guarantees. Past performance is not indicative of future results. Investing involves risk, including the potential loss of principal.